Your office has invested in new and exciting Dentrix Detect AI technology. Your team and your patients seem to each have responded positively to the annotations and the educational opportunity that this technology provides. But you might wonder how it has helped you identify needed treatment. Have your patients responded by completing those procedures that you treatment planned? How has your investment paid off?
Think about the information you really want to know:
- How many procedures have been treatment planned since you began using Dentrix Detect AI?
- Which individual procedures were treatment planned?
- Of those treatment-planned procedures, how many were actually completed?
- How much production was generated from those completed procedures?
- What percentage of your treatment-planned procedures are being completed?
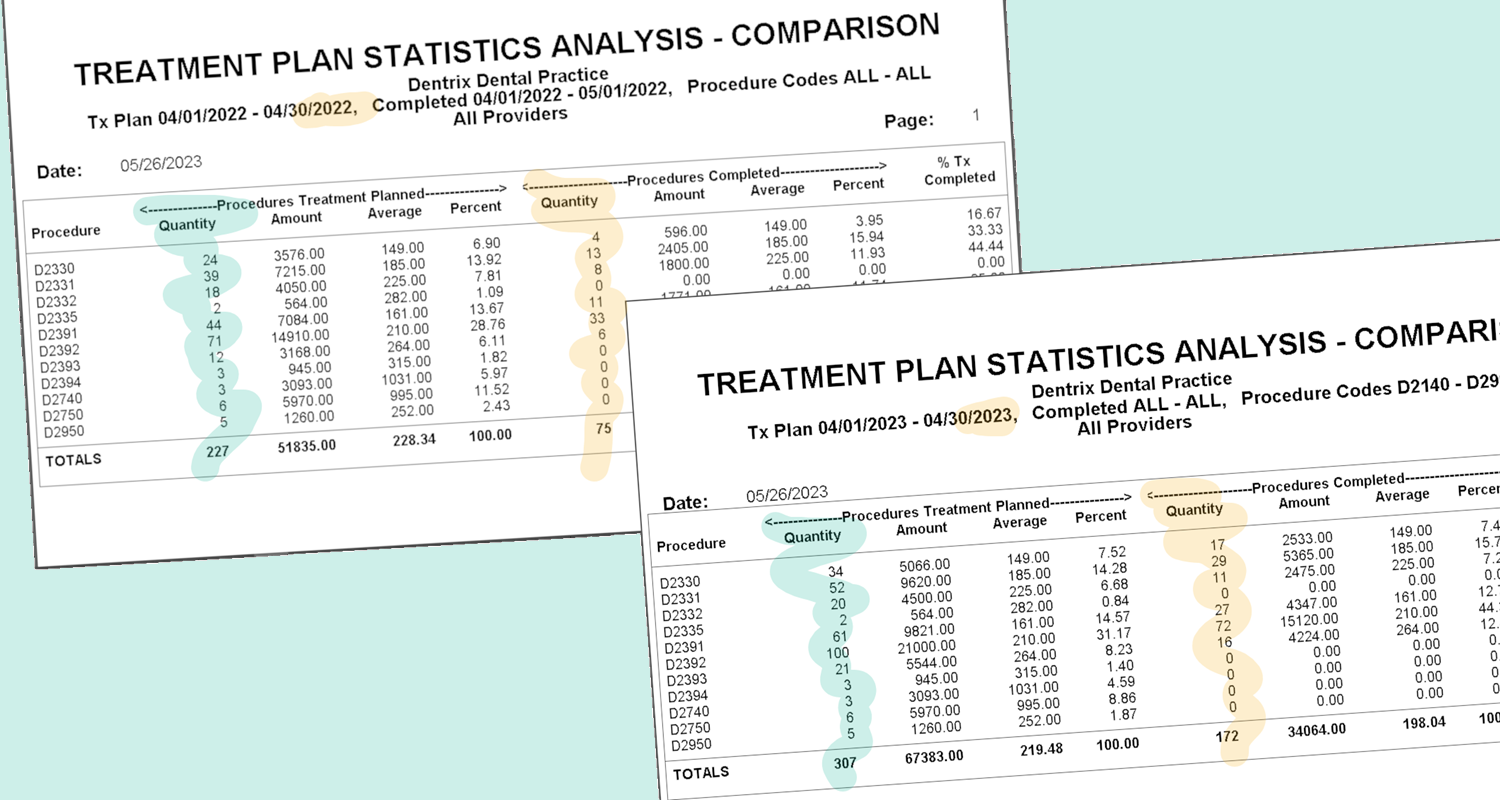
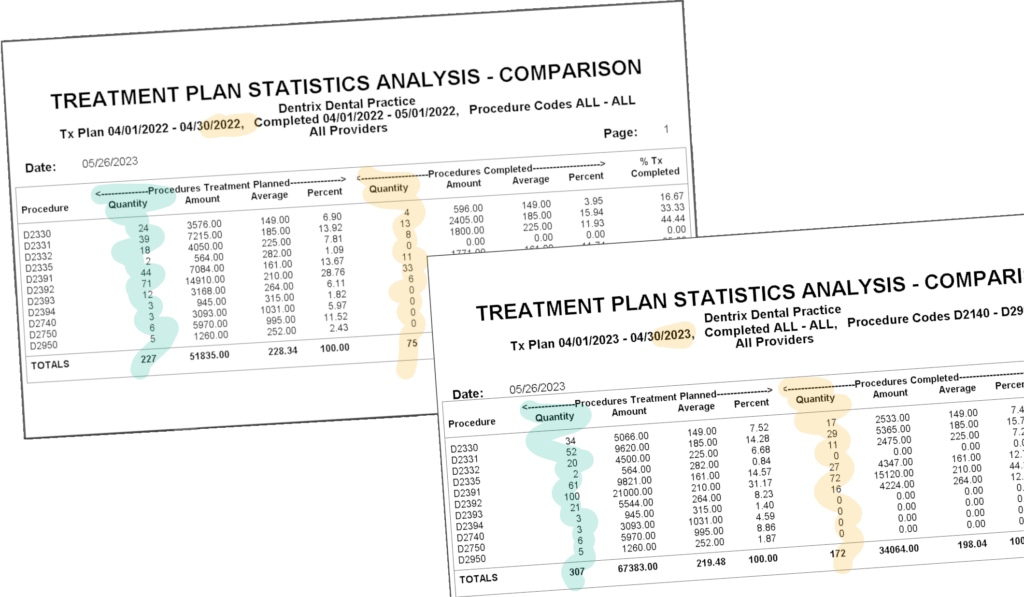
With the Treatment Plan Statistics Analysis – Comparison Report, you can see the comparison of procedures you’ve treatment planned with those you’ve completed over a specific time period. And you can even look at how those numbers have changed year over year by generating multiple reports for the different time periods you want to compare.
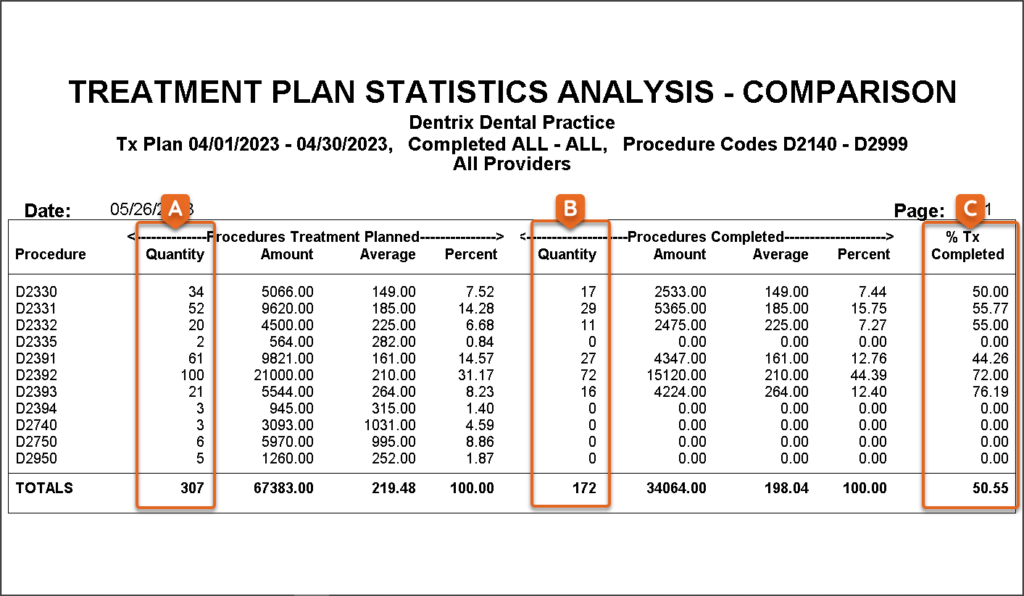
For each procedure code on the report, you’ll see the following:
A. Treatment Planned Quantity – After your doctors have used Dentrix Detect AI to help detect areas of concern, your team responded by adding these codes to patients’ treatment plans.
B. Completed Quantity – After educating patients about the need for the treatment, this number indicates how many of each procedure were completed.
C. Treatment Completed Percentage – The ratio of treatment planned versus completed procedures is calculated as a percentage, which is easy to read at a glance.
Generating the Report
The Treatment Plan Statistics Analysis – Comparison Report, accessible from the Office Manager, has several settings to help you find the comparison information you are looking for.
From the Office Manager, click Reports, then Management, and then Treatment Plan Statistics Analysis. Apply the following settings to see a comparison of treatment planned vs. completed procedures over a date range:
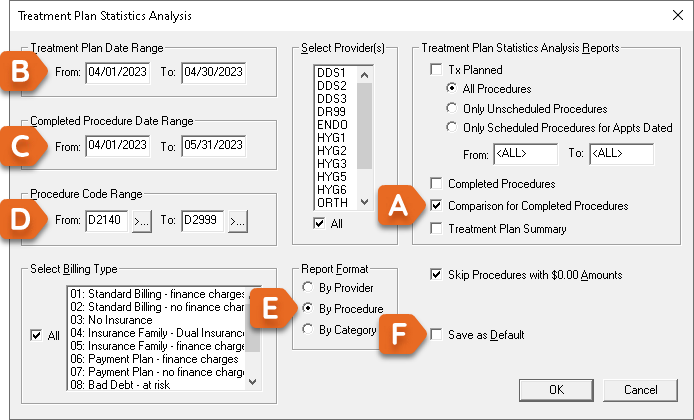
A. Under Treatment Plan Statics Analysis Reports, select Comparison for Completed Procedures. Selecting this report before choosing the other settings will unlock other options in this dialog box that you will also need to adjust.
B. Under Treatment Plan Date Range, enter a month’s range when the work was originally treatment planned: for example, April 2023.
C. Under Completed Procedure Date Range, enter a slightly larger range when you expected the work to be completed: for example, April – May 2023.
D. Under Procedure Code Range, enter a range of procedures that you want to examine; for example, choose restorative procedures that you diagnosed to treat caries.
E. Set the Report Format to By Procedure. This will detail the results for each of the procedure codes that you selected earlier.
F. Optionally, you can select Save As Default. When you do so, Dentrix saves these selected options. When you generate the report again from this workstation, you will only need to change the date ranges to create the same report again.
For other options, such as Select Billing Type and Select Providers, select the All option to view the results for the whole practice. Later, if you want to look at individual providers or groups of patients, you can come back and run the report again using these filters.
Once you’ve selected your options, click OK to generate the report and send it to the Batch Processor. From the Batch Processor, you can print or preview the report.
Making the Comparison
To see your ROI, generate the same report again using the same options, but this time enter the previous year for the date ranges. Compare the two reports, and you’ll easily see just how the treatment planned and completed information changed for the same time period before and after you began using Dentrix Detect AI!
It is exciting to see how new technologies can improve your team’s ability to educate your patients and improve their case acceptance. The Treatment Plan Statistics – Comparison Report is a great tool to quantify that progress.
Learn More
For additional information, see the following:
By Ryan Beardall, Contributing Editor


